Manufacturing
Manufacturing Operations & OEE Dashboard
See the shop floor as it runs
Illustrative solution blueprint — a representative build demonstrating our engineering approach, not a client engagement.
Overview
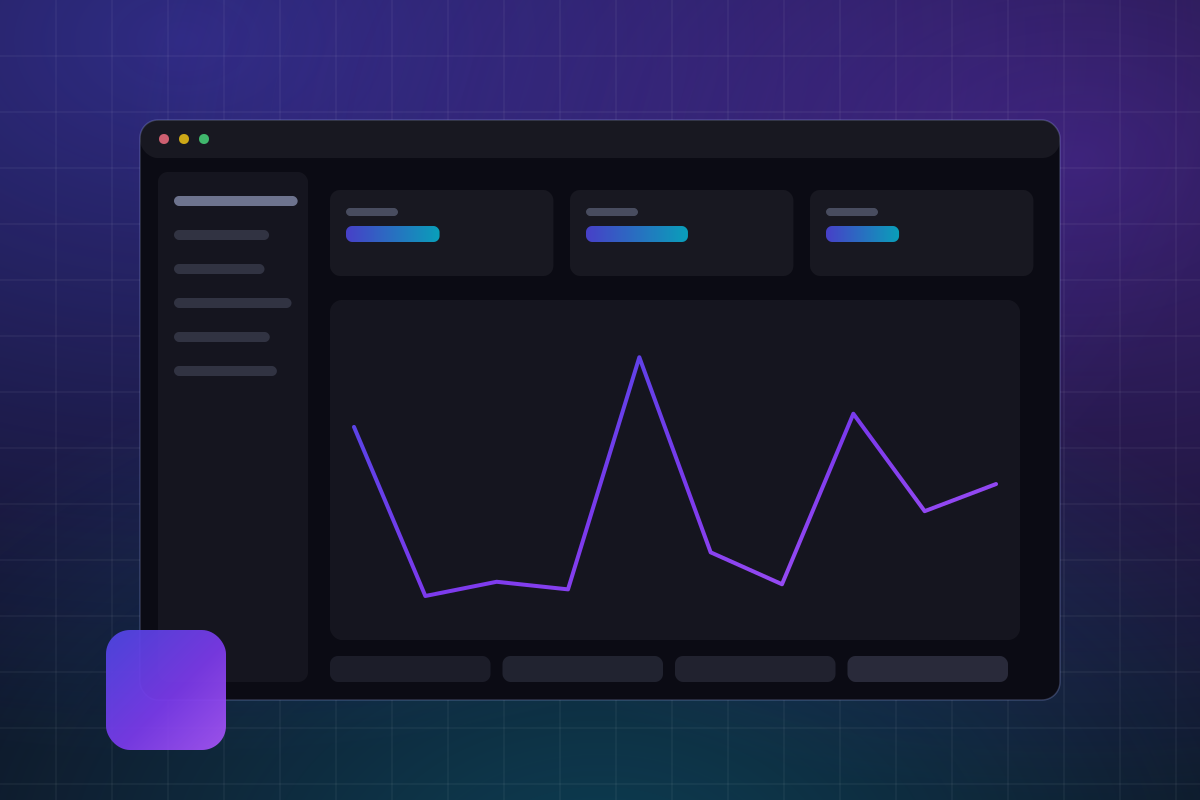
This blueprint lays out a plant operations dashboard: machine status, OEE (availability, performance, quality), downtime reasons, and production against plan — live, on screens the whole floor can see. It targets manufacturers whose production data sits in PLCs, historians, and paper logs that never meet.
The design assumes messy inputs. Machine signals arrive over OPC UA or MQTT at different rates and quality, older equipment needs retrofit sensors or manual entry, and the pipeline is built to normalize all of it into one production data model.
The problem space
The Challenge
Most plants discover problems a shift late: downtime is logged on paper, OEE is assembled in a spreadsheet days after the fact, and the morning meeting argues about numbers instead of causes. The data exists — PLCs and SCADA systems emit it constantly — but it is trapped in isolated systems with incompatible formats and no shared definition of what a stop or a good count means. Useful analytics need a pipeline that turns raw signals into consistent, trusted production events.
How we'd tackle it
Our Approach
We would start with the data contract: a canonical production event model — run, stop, reason, count, scrap — that every source maps into, whether it arrives from an OPC UA gateway, an MQTT broker, or an operator tablet. Python stream processors compute OEE and detect state changes continuously rather than in nightly batches, writing to time-partitioned PostgreSQL tables. Dashboards are React, designed for wall displays first: high contrast, glanceable, and current within seconds.
Under the hood
Architecture
- 1
Edge gateway ingesting PLC signals over OPC UA and MQTT into a message stream
- 2
Python stream processors computing OEE, state changes, and downtime classification
- 3
Canonical production event model normalizing data across heterogeneous machines
- 4
PostgreSQL with time-partitioned tables for high-volume telemetry history
- 5
React + TypeScript dashboards optimized for wall displays and tablets
- 6
Operator tablet flow for downtime reason codes and manual counts
- 7
Containerized deployment on Azure with on-premises edge components
Capability surface
Key Features
The functional scope this blueprint covers end to end.
Live machine status board with state, current job, and run rate
OEE tracking by machine, line, shift, and product
Downtime capture with reason codes and Pareto analysis
Production-versus-plan tracking against shift targets
Scrap and quality event logging at the station
Andon-style alerts when lines stop or rates fall below threshold
Shift handover reports generated from live data
Historical trend views across weeks and product runs
Engineering goals
What This Blueprint Optimizes For
Design goals we engineer toward — stated as targets, not claimed results.
Floor displays reflect machine state within seconds of the event
One agreed production data model across PLC, SCADA, and manual sources
Dashboards readable at a glance from across the floor
Pipeline tolerant of edge disconnections, with automatic backfill on reconnect
Months of telemetry queryable without slowing live views
Roadmap thinking
Where We'd Take It Next
Predictive maintenance models trained on downtime and sensor history
Energy monitoring per machine and per production run
Digital work instructions linked to the active job
Automated root-cause suggestions for recurring downtime patterns
Tech Stack
The technologies this blueprint is designed around.
- React
- TypeScript
- Python
- Data Pipelines
- PostgreSQL
- Redis
- Microsoft Azure
- Docker
Related Services
Curious What This Would Look Like for You?
We'll map your requirements against a blueprint like this — architecture, stack, and roadmap — before you commit to anything.